Features
- Simultaneous thermal and visual imaging with blendable view
- Non-contact temperature measurement (14°F to 480°F / −10°C to 250°C)
- Photo capture to micro SD card for documentation
- Hot/cold tracker to highlight temperature extremes
- Adjustable emissivity (0.1 to 1.0) for improved accuracy on different materials
- Includes PC report-writing software
- Kit includes battery, fast charger, micro SD card, and carrying box
Specifications
| Battery Chemistry | XR Lithium Ion |
| Battery Included | 1 (12V MAX Li‑ion) |
| Number Of Pieces | 6 |
| Product Weight | 1000 g (1 kg) |
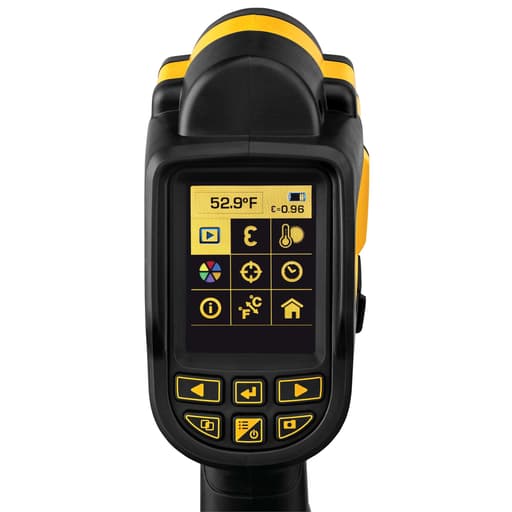
| Display Size | 2.2 in |
| Display Type | 2.2" color LCD for visual, thermal (15x15) and blended images |
| Thermal Array Resolution | 15 x 15 |
| Temperature Measurement Range | 14°F to 480°F (−10°C to 250°C) |
| Temperature Storage Range | -25°F to 122°F (−32°C to 50°C) |
| Operating Temperature Range | 23°F to 113°F (−5°C to 45°C) |
| Accuracy | Below 200°F: ±3.6°F; Above 200°F: ±2% (assumes ambient operating conditions) |
| Adjustable Emissivity | 0.1 to 1.0 (adjustable in increments of 0.01) |
| Field Of View / Ifov | Spot (IFOV) 1" @ 39.3" (25 mm @ 1 m) |
| Data Storage | Photo capture (visual, thermal and blended) on micro SD card |
| Includes | Imaging thermometer, micro SD card, report writing software (download), (1) 12V MAX Li‑ion battery, fast charger, kit box |
| Warranty | 3 Year Limited Warranty; 1 Year Free Service; 90 Days Satisfaction Guaranteed |
Related Tools
Handheld imaging thermometer that captures both thermal and visual images and can blend them for easier diagnosis. It performs non-contact temperature measurements from 14°F to 480°F (−10°C to 250°C), stores image data to a micro SD card, and includes report-writing software. Typical applications include electrical inspection, HVAC, plumbing, automotive diagnostics, and general maintenance.
DeWalt 12V MAX Imaging Thermometer Kit Review
I reached for the DeWalt thermal imager on a chilly morning to chase down drafts around a 1950s front door. Within minutes, I had a set of blended images that clearly showed exactly where the weatherstripping had given up. That’s the appeal here: quick, non-contact visuals that tell a story your eyes can’t see.
What it is and how it’s built
This is a compact, 12V handheld imaging thermometer that fuses a visible camera with a low-resolution thermal array. It captures thermal, visual, and blended images to a micro SD card and ships as a full kit: battery, fast charger, card, and a case. The display is a 2.2-inch color LCD—small but serviceable—and the whole unit weighs about a kilogram, which gives it a solid, tool-like feel rather than gadgety lightness.
DeWalt gives you some meaningful controls: adjustable emissivity from 0.1 to 1.0 in 0.01 increments, a hot/cold tracker to flag the warmest and coolest points in the scene, and a temperature range that spans 14°F to 480°F (−10°C to 250°C). Accuracy is specified at ±3.6°F below 200°F and ±2% above that, assuming you’re within the operating temperature band.
Thermal performance and image quality
Let’s talk about the array: 15 × 15 pixels. That’s a sparse 225-point grid compared to modern thermal cameras, and you feel it if you expect photographic detail. The way around that is the blended view—the overlay of thermal data on the visible image. In practice, that blend is the make-or-break feature. On its own, the thermal grid is too blocky for fine diagnosis, but when you align it with the visual scene, the information becomes actionable. Cold air sneaking in around a jamb, heat loss at a poorly insulated header, a warm breaker on a subpanel—they’re all easy to spot because the context is right there.
The imager’s instantaneous field of view per pixel (IFOV) is listed as 1 inch at 39.3 inches (25 mm at 1 meter). In plain terms, each thermal pixel “sees” a roughly 1-inch spot at about three feet. If you stand farther back, that spot grows and detail gets muddy. The takeaway is simple: get close. For building envelope work, I’ve been happiest scanning within 1–3 feet of the target; in electrical enclosures, I’m often 8–18 inches away.
Accuracy and emissivity
For non-contact temperature measurement, emissivity is the deal-breaker many people overlook. Here you can dial emissivity between 0.1 and 1.0 in fine 0.01 steps, which is great. Painted surfaces and drywall often live near 0.9–0.95; shiny copper and aluminum are far lower and will read incorrectly unless you compensate. The imager’s controls make that easy. For shiny metal, I’ll often lay a small piece of matte tape or a dab of flat paint to create a consistent reading target—an old thermography trick that works well with this tool.
The specified accuracy is reasonable for troubleshooting HVAC, electrical, and maintenance issues, but it’s not a commissioning-grade instrument. If you’re documenting critical deltas on low-temperature gradients, you’ll want to validate with a contact thermometer. For hunting heat sources, cold bridges, or clogged hydronic loops, the DeWalt is perfectly adequate.
In the field: where it shines
- Building and HVAC: Blended images make it quick to identify missing insulation, leaky weatherstripping, cold air returns that aren’t sealed, and undersized baseboard runs. The hot/cold tracker helps zero in on the extremes so you can move quickly.
- Electrical: Within the 480°F ceiling, you can compare breaker temperatures under load, spot a loose lug on a subpanel, or evaluate a motor bearing after a run cycle. The tracker highlights anomalies immediately.
- Plumbing: Tracing hot and cold supply lines behind drywall is straightforward within a few feet. Radiant floor zones show up clearly when the loop is flowing; you’ll see colder zones where a circuit is air-bound or not circulating.
- Automotive: Thermal differences across exhaust headers or coil packs stand out, making preliminary diagnosis faster.
For all of these, the capture-to-SD workflow is painless. I snap thermal-only, visual-only, and blended versions of the same scene so I have options when writing up a report.
Usability and workflow
The small 2.2-inch screen isn’t luxurious, but the interface is simple enough to use with gloves. I like that it boots quickly, and the hot/cold tracker toggles without hunting through deep menus. The kit approach is welcome—battery and fast charger in the box means you’re not stranded.
On the backend, the provided PC report-writing software is basic but does what it says: import images from the micro SD card, embed temperatures, add notes, and export a tidy PDF. If you’re documenting a maintenance routine or sharing findings with a client, this saves time compared to cobbling together screenshots manually.
Limitations to keep in mind
- Resolution: 15 × 15 is low. Expect to move in closer to your target and rely on blended images to maintain context. This is not for detailed thermal analysis on distant targets.
- Temperature ceiling: 480°F (250°C) covers most residential and light commercial tasks but won’t replace a high-temp imager for industrial furnace work or high-performance exhaust systems.
- Display size: The 2.2-inch LCD is small by today’s standards. It’s fine for framing and checking the tracker, but serious review happens after offloading the images.
- Operating environment: The tool is rated to operate down to 23°F (−5°C). If you work outdoors in colder climates, plan accordingly or let the tool acclimate before use.
- Spot size and distance: That 1-inch-at-3-feet IFOV is a hard constraint. If you’re scanning from across a room, you’ll miss small anomalies. Close the distance to collect reliable data.
None of these are dealbreakers in its intended use, but they’re worth understanding up front.
Tips for better results
- Use emissivity wisely: Set it to match the material, or create a high-emissivity target with tape or flat paint on reflective surfaces.
- Stabilize conditions: For envelope work, run the HVAC to create a temperature delta indoors vs. outdoors. A 10–20°F difference makes problems pop.
- Capture in sets: Take a visual, thermal, and blended shot of each scene so you can tie temperature data to physical context later.
- Mind the distance: Work within a couple of feet when you need to distinguish between studs, wires, or narrow air gaps.
- Cross-check critical numbers: If a precise temperature matters, verify with a contact probe.
Value and who it’s for
This imager sits in a middle ground: more informative than a basic spot IR thermometer (thanks to stored, blended images and hot/cold tracking), but not as detailed as a higher-resolution thermal camera. If your work benefits from quick, visual confirmation—home inspections, facilities maintenance, HVAC service, light electrical troubleshooting—it hits a sweet spot of capability, simplicity, and documentation. The kit contents and DeWalt’s 3-year limited warranty (plus 1-year service and a 90-day satisfaction guarantee) don’t hurt, either.
If you need to scan a whole facade from the sidewalk, or you’re doing detailed thermal audits with strict reporting standards, the low array resolution and small screen will feel limiting. If you mostly want to spot-check temperatures on shiny metal from a distance, a spot IR gun might be cheaper and more appropriate.
Final recommendation
I recommend the DeWalt imaging thermometer for tradespeople and serious DIYers who want fast, context-rich thermal snapshots for everyday troubleshooting. The blended imaging, hot/cold tracker, adjustable emissivity, and micro SD capture make it genuinely useful in the field, and the included kit means you’re ready to work out of the box. Just be realistic: it’s a close-range tool with a coarse thermal grid. If you work within those boundaries—and use the blend wisely—it delivers clear, actionable insights without the complexity of a full-blown thermal camera.
Project Ideas
Business
Budget Home Heat-Loss Surveys
Offer an affordable thermal walkthrough for homeowners and landlords to identify drafts, insulation gaps, and leaky windows/doors. Deliver a concise PDF report using the bundled software with annotated blended images, prioritized fixes, and estimated DIY/material costs.
Electrical Hotspot Spot-Checks
Provide routine thermal inspections of panels, breakers, busbars, and high-load outlets for small businesses and property managers. Flag abnormal temperature deltas that indicate loose connections or overloads. Include a quarterly subscription with before/after images for compliance records.
Plumbing & Radiant Floor Mapping
Use the imaging thermometer to visualize radiant heating loops, underfloor hot-water lines, and potential pipe leaks behind walls. Produce floorplan overlays showing warm/cool paths to guide repairs and reduce unnecessary demolition.
Commercial Kitchen Surface Balancing
Calibrate griddles, warming stations, and holding cabinets by mapping hot/cold zones within the 14°F–480°F range. Provide chefs with quick setup guides and sticker placements for consistent searing and proofing. Offer quarterly rechecks after equipment moves or maintenance.
Automotive Quick Diagnostics
Partner with local shops or run mobile clinics to check brake rotor balance (relative temps), misfiring cylinders (exhaust manifold temps), cooling system performance, and catalytic converter activity. Deliver photo-backed reports that upsell targeted repairs and reduce guesswork.
Creative
Thermal Portrait Series
Capture blended thermal/visual images of people holding warm or cold items (mugs, ice packs) to reveal unique heat signatures. Print the blended images on transparent film layered over the original photo for a striking diptych. Use the hot/cold tracker to accentuate highlights, and adjust emissivity for glasses, metal jewelry, or shiny clothing.
Heat-Map Quilt or Wall Hanging
Scan a room to record temperature zones along walls, windows, and vents. Translate the thermal gradients into fabric colors to sew a quilt or wall tapestry that mirrors your home’s heat-loss patterns. Include embroidered legend tags for temperatures and a stitched floor plan outline based on the visual image.
Kitchen Heat Art
Map the heat distribution on pans, griddles, and baking sheets at various burner settings. Print the blended thermal images as an art series with captions like “Medium Flame, Cast Iron.” Turn the series into a poster set for the kitchen or a cookbook insert that pairs thermal images with recipes.
Infrared Scavenger Hunt
Create a family or classroom game by hiding warmed or chilled objects behind fabric or cardboard. Players use the imaging thermometer to find hotspots or cold spots and collect clues. Rotate emissivity settings for different materials to teach how surfaces change thermal readings.
Microclimate Garden Map
At dusk or dawn, scan garden beds, soil, and hardscape to identify warm and cool microzones. Produce a blended thermal/visual map, then paint stones or make plant markers that reflect the temperature zones to guide planting heat-loving vs. cool-season crops.